|
|
|
|
|
Clustergrammer——基于网络的高维生物数据热图可视化和分析工具 |
|
|
论文标题:Clustergrammer, a web-based heatmap visualization and analysis tool for high-dimensional biological data
期刊:Scientific Data
作者:Nicolas F. Fernandez, Gregory W. Gundersen, Adeeb Rahman, Mark L. Grimes, Klarisa Rikova, Peter Hornbeck, Avi Ma’ayan
发表时间:2017/10/10
数字识别码:10.1038/sdata.2017.151
原文链接:https://www.nature.com/articles/sdata2017151?utm_source=Other_website&utm_medium=Website_links&utm_content=RenLi-MixedBrand-multijournal-Multidisciplinary-China&utm_campaign=ORG_USG_JRCN_RL_article_promotion_sciencenet_Oct_3rd
生物医学研究领域高通量实验方法的多样性正在迅速增长。尽管数据采集的速度不断加快,我们从这些数据中得出有效结论的能力却有所滞后。数据可视化是生物数据初步分析的主要步骤,一些常用的降维方法,例如主分量分析(PCA)和t分布领域嵌入算法(t-SNE),常常被用于将高维数据映射至二维或三维空间中,以实现可视化。然而,由高维空间向低维空间转换的代价很大,经常导致信息的丢失。与之相对,聚类图(clustergram)或者热图技术可直接将数据进行可视化而无需降维。聚类图易于解释,广泛应用于生物数据可视化的印刷出版物中。
大多数分层聚类热图可视化工具产生的都是静态图像。发表在《科学数据》的一篇研究Clustergrammer, a web-based heatmap visualization and analysis tool for high-dimensional biological data中,来自美国依坎医学院的AviMa’ayan及同事向我们详细介绍了Clustergrammer。Clustergrammer是一个基于网络的可视化工具,拥有许多交互特征,如缩放、平移、过滤、重排、分享、执行富集分析、提供动态基因注释等。Clustergrammer可通过向网站上传数据表或嵌入至Jupyter Notebooks,产生可分享的交互式可视化结果。开发者甚至可以将Clustergrammer的核心库作为一个工具箱,嵌入自己的应用程序来实现可视化。
作者利用不同的数据演示了Clustergrammer的功能:癌细胞系百科全书(CCLE)的基因表达数据,利用质谱分析法从肺癌细胞系采集的原始翻译后修饰数据,以及质谱流式细胞仪测得血液中单细胞蛋白质组的原始数据。结果证明,Clustergrammer可分析多种生物数据,并产生基于网络的交互式可视化图表。
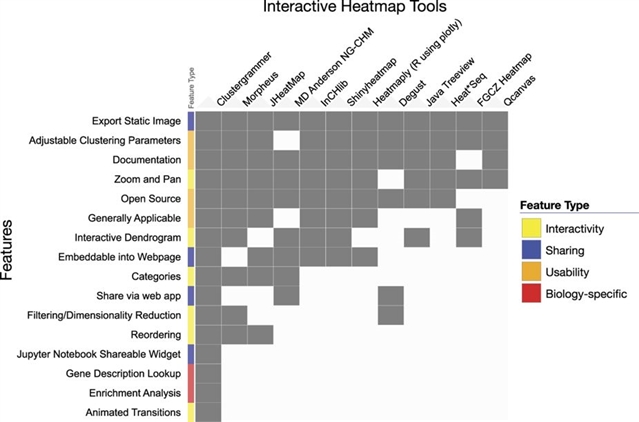
图1. 交互式热图工具特征对比
摘要:Most tools developed to visualize hierarchically clustered heatmaps generate static images. Clustergrammer is a web-based visualization tool with interactive features such as: zooming, panning, filtering, reordering, sharing, performing enrichment analysis, and providing dynamic gene annotations. Clustergrammer can be used to generate shareable interactive visualizations by uploading a data table to a web-site, or by embedding Clustergrammer in Jupyter Notebooks. The Clustergrammer core libraries can also be used as a toolkit by developers to generate visualizations within their own applications. Clustergrammer is demonstrated using gene expression data from the cancer cell line encyclopedia (CCLE), original post-translational modification data collected from lung cancer cells lines by a mass spectrometry approach, and original cytometry by time of flight (CyTOF) single-cell proteomics data from blood. Clustergrammer enables producing interactive web based visualizations for the analysis of diverse biological data.
阅读论文全文请访问:https://www.nature.com/articles/sdata2017151?utm_source=Other_website&utm_medium=Website_links&utm_content=RenLi-MixedBrand-multijournal-Multidisciplinary-China&utm_campaign=ORG_USG_JRCN_RL_article_promotion_sciencenet_Oct_3rd
期刊介绍:Scientific Data (https://www.nature.com/sdata/) is a peer-reviewed, open-access journal for descriptions of scientifically valuable datasets, and research that advances the sharing and reuse of scientific data. Scientific Data welcomes submissions from a broad range of research disciplines, including descriptions of big or small datasets, from major consortiums to single research groups. Scientific Data primarily publishes Data Descriptors, a new type of publication that focuses on helping others reuse data, and crediting those who share.
The 2017 journal metrics for Scientific Data are as follows:
•2-year impact factor: 5.305
•5-year impact factor: 5.862
•Immediacy index: 0.843
•Eigenfactor® score: 0.00855
•Article Influence Score: 2.597
•2-year Median: 2
(来源:科学网)
特别声明:本文转载仅仅是出于传播信息的需要,并不意味着代表本网站观点或证实其内容的真实性;如其他媒体、网站或个人从本网站转载使用,须保留本网站注明的“来源”,并自负版权等法律责任;作者如果不希望被转载或者联系转载稿费等事宜,请与我们接洽。